5 KPIs to use with Xero Practice Manager and Microsoft Power BI
How do you currently track KPI's in your accounting firm? Cameron Lynch shares 5 metrics.

Having a clear view of your firm’s revenue performance so you can properly manage your business is something we’re pretty serious about at Ignition. When our founder, Guy Pearson, started his own cloud accounting firm in 2009, he knew keeping track of client engagements, payments, revenue, KPIs and OKRs would be crucial to success. For his firm, Interactive Accounting, it turned out that real-time, centralised metrics – all in the one place, ultimately meant he had the visibility to grow the business to what it is today.
We chat with thousands of accounting firms worldwide and we can't help but notice many practices are using disconnected systems. This problem presents an opportunity – for your data to flow between systems in a meaningful and tangible way. To play a part in educating our community, we've joined with Cameron Lynch to show you five KPI’s you can use with Xero Practice Manager (XPM) and Power BI.
Why XPM and Power BI? Accounting firms like yours can connect a suite of tools – Ignition, Xero, Xero Practice Manager, Xero Tax and Power BI (depending on what's available in your country).

Power BI by Microsoft adds a new dynamic to your suite – most professionals are still exploring this. While we focus on helping you win clients and get paid, we know there's huge value in tying all the data points together in your Xero suite of tools. That way, you can have visibility over meaningful, tangible reporting in Power BI.
Thanks Cameron for sharing your expertise and letting us in on your best practice knowledge for running a pioneering, cloud-based accounting firm in 2019.
5 KPIs to use with Xero Practice Manager and Power BI
Xero Practice Manager (XPM) has become a popular choice for accounting firms as a job management software. It connects to XeroHQ, it’s cloud based, and it’s flexible with the availability of custom fields.
Currently, internal staff inside accounting firms are spending days preparing monthly board reports on the important metrics partners want to see. To do this, staff are mostly likely using the trusted, but time consuming, Microsoft Excel. Imagine a reporting system that not only removes this admin process but also delivers live and dynamic reports that partners and staff can review any time. Welcome to Microsoft Power BI.
Benefits of using Microsoft Power BI for your internal reporting
Flexibility
Think of Power BI as providing you with your own canvas on which to create artwork. You can still have templates pre-loaded to save yourself time, but you’ll be able to have powerful leverage over the flexibility of the data, visualisations, filters, colours, sizes. Literally everything can be manipulated to suit you.
Slicing
The functionality of Power BI encourages interaction in a live and dynamic environment. Searching or filtering by year, quarter, month, day, staff member, job ID, client name, client group, partner or manager. It provides the answers you’d like and is able to drill down into one individual circumstance.
Segmentation
Power BI gives you one source of truth, that can be segmented to individual staff members, teams, managers, partners, and boards. For example, it’s not always appropriate to have a staff member viewing another staff member’s performance. But, it’s equally important for a partner to be able to view all staff in one report as it is to have a bird’s eye view on performance.
My Background
When I worked in practice, I was tracked on 2 KPIs: Productivity and Write-Offs.
Productivity - there were roughly 1800 hours of time available in a 48-week financial year, and I needed to be 80% productive (meaning roughly 1400 hours needed to be billed to a client in my timesheets). The rest was used for my coffee breaks and watching NBA on the downstairs TV 😏.
Write Off % - of these 1400 hours, I had a charge out rate and it needed to be passed on to a client via invoice. If it wasn’t, it would be classified as a write off. My KPI was to be under 7.5% in write-offs.
Now, I’m not telling you anything new here. But, things have evolved since I was in practice. Accounting firms have become a lot more creative in the way they bill and report. Value-based billing, team-oriented KPIs and monthly pricing for a range of different services have all become popular. Given this, the KPIs have evolved as well. However, we are creatures of habit. There are still your staple KPIs that firms continue to track.
Let’s explore... Here are the 5 most tracked KPIs with Power BI and Xero Practice Manager for accounting firms.
1. Productivity Percentage Report
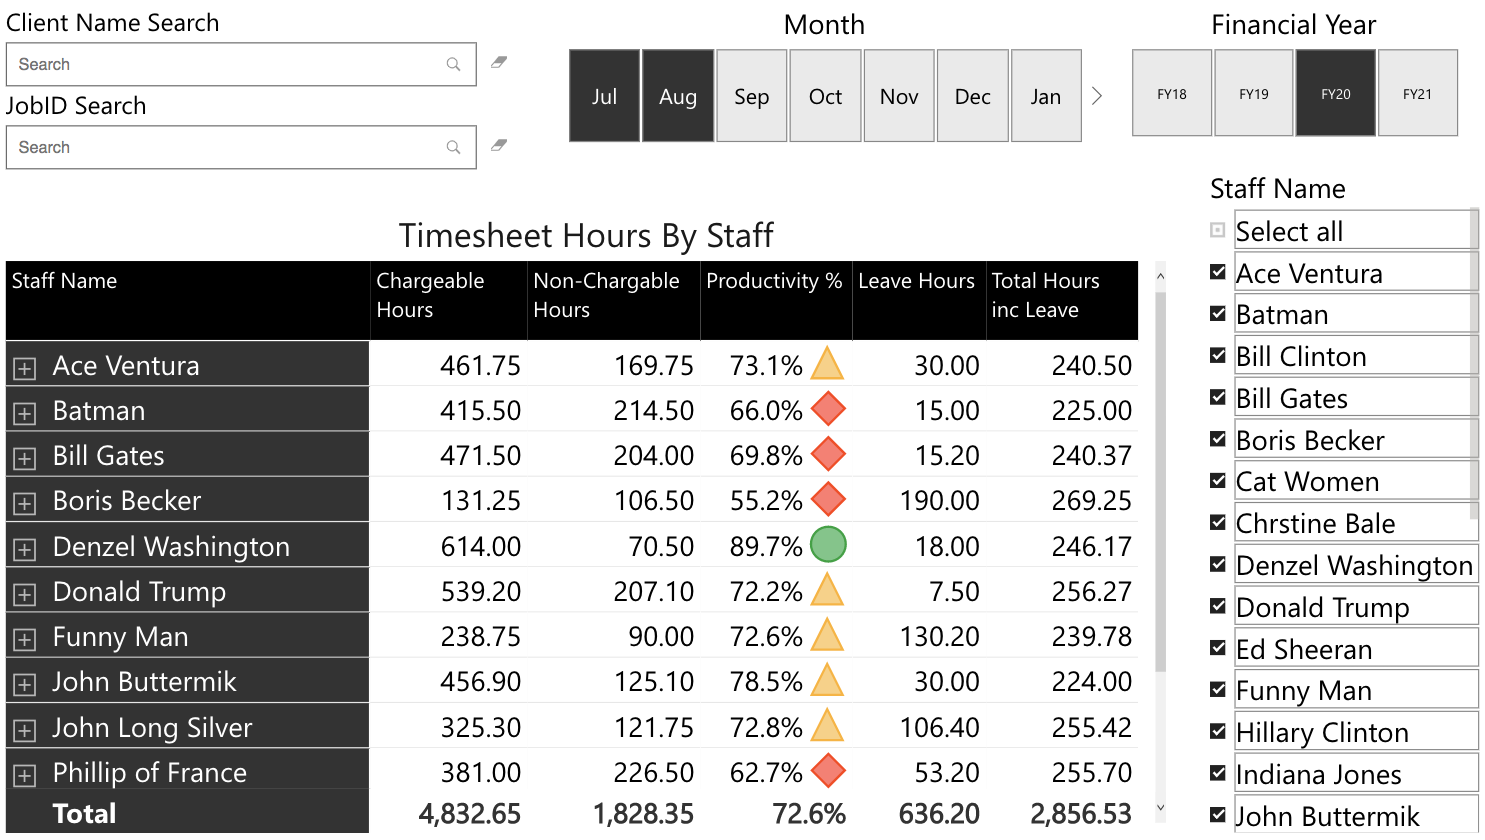
Tracking individual staff members is immensely powerful and useful in most firms. In particular, productive hours and having the flexibility to adjust the productivity percentage. Junior accountants need to be approximately 80% productive, while a partner may only need to be 25% productive for the month as they are involved in strategic direction, internal processes, or bringing in new fees.
The drilldown in this example is as follows: Staff Member > Client Group > Client Name > JobID. Then, along the columns above we look at the different types of hours within this timesheet.
Having this live and dynamic report for staff members to review at any point in time is useful. The data itself has been reviewed like this for years. However, the big difference now is that the data is automated, the slicing filters are dynamic, and you can quickly redesign the layout to pick up extra criteria.
2. Fees by Partner/Manager
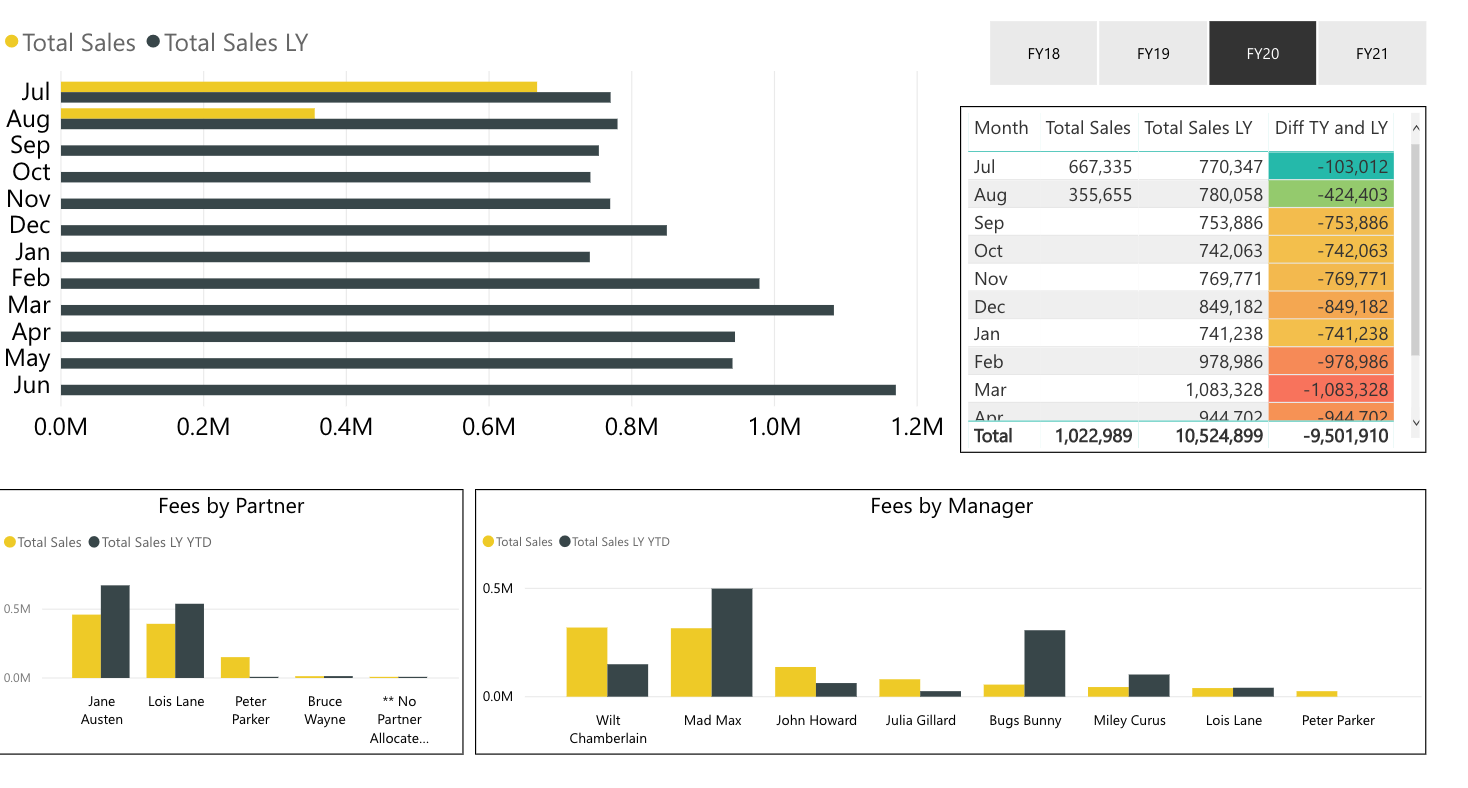
Like productivity percentage reports, fee-based reporting has also failed to evolve over the years. This report is particularly important for partners, and to a lesser extent, managers. Fee base is something of great interest, particularly when it comes to equity and wage discussions inside the business.
As a partner, the upside of having a report like this at your disposal is for the YTD comparison. You can simply check your phone and know that, as of 15 October 2019, you are tracking above your budget. Turning to desktop, you’ll have access to further answers with more screen real estate, allowing you to explore which clients are the reason for this performance, which month did you perform best, etc.
Most board decks will include a version of this report to allow partners a high-level view of performance against a budget.
3. Average Charge Out Rate
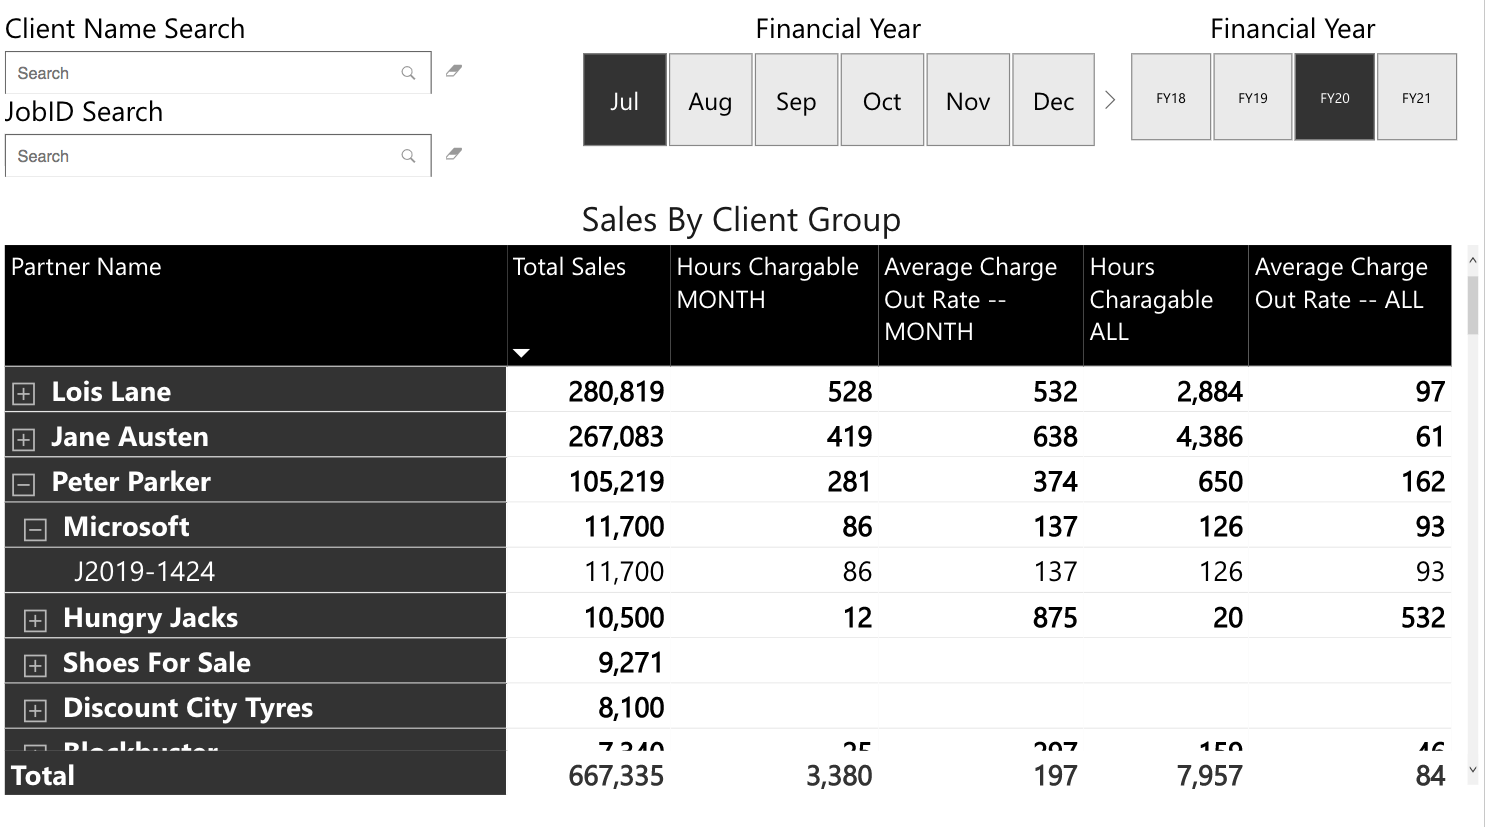
Average Charge Out Rate has become more difficult to calculate as new methods of billing (monthly, value priced, etc.) have grown in popularity. However, it is still a valuable indication of profitability on jobs. Correct settings inside XPM are critical to obtain accurate reporting. Tools like Microsoft Power BI, or the reliable and time-consuming Microsoft Excel have helped.
Having the correct setup in XPM allows you to get more in depth reporting on your services and jobs. Eg. Which of compliance fees, audit fees, management reporting or business advisory is giving you a greater return? Which manager and staff member combo performs best together as a team across multiple jobs in the financial year?
The report is regularly used at month end to analyse poor performing staff and client profitability issues.
4. Average Job Turnaround Time
As with average charge out rate, Turnaround Time has also become difficult to track with the evolvement of billing practices. For example, with monthly billed clients, it is now best practice to leave the job open for the entire financial year. This makes job turnaround time less valuable.
There are ways to get around this by, for example, segmenting your monthly clients from your regularly open and close jobs. It is important to have good reporting practices as, once aligned, reports like job turnaround time are invaluable - particularly if you can group job turnaround times by job type and fee size. A standard $10k annual compliance job could carry a benchmark turnaround of 25 days. Being able to slice by partner, manager, time of year or office, can identify issues in the chain.
Prioritising job turnaround time can also encourage better preparation and job planning from managers. Teams are then encouraged to plan job completions around staff annual leave, and improve communication and expectations from clients.
5. Write Offs
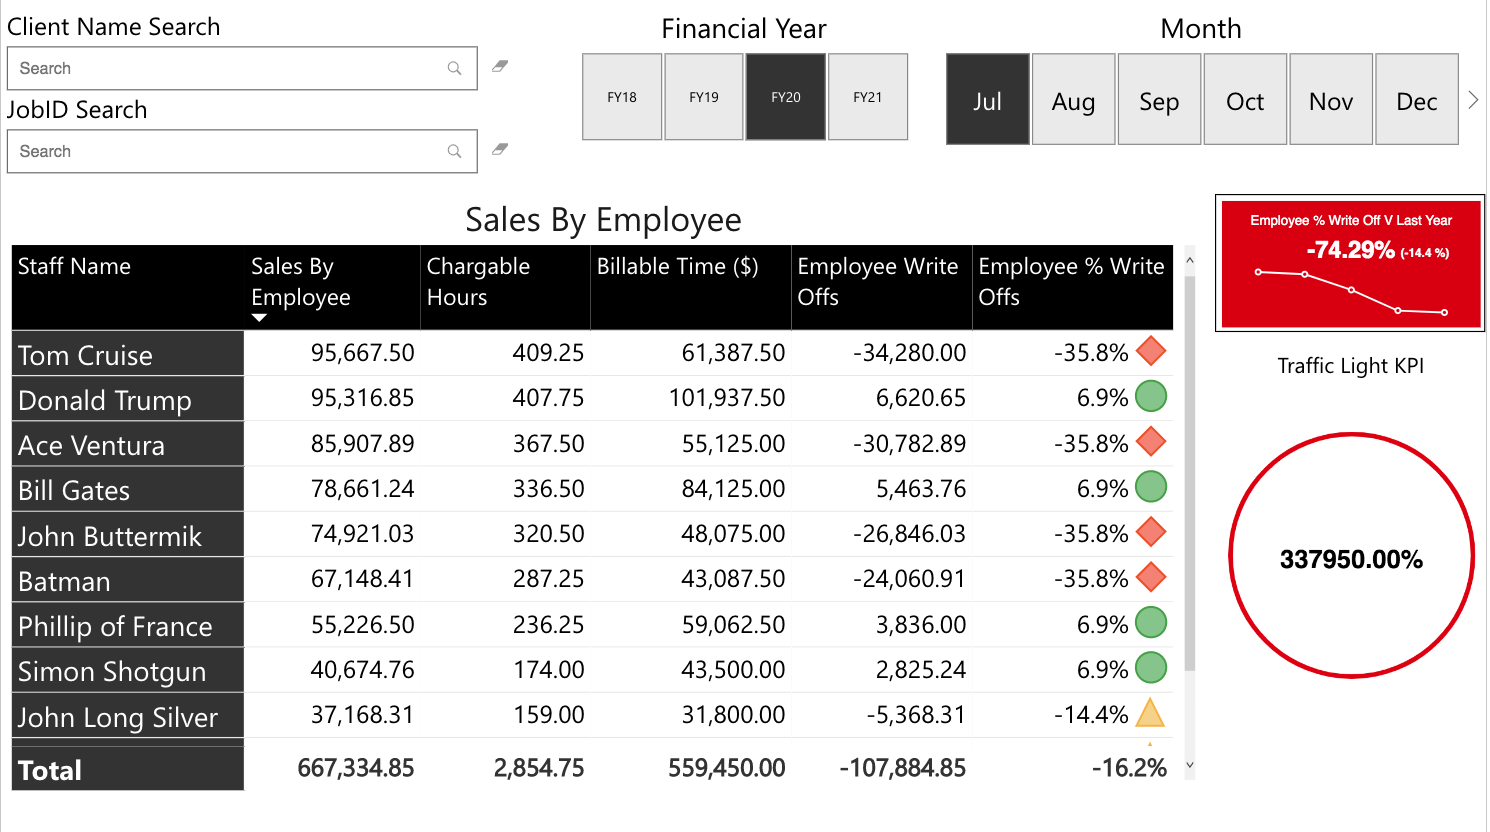
Whether you are tracking write offs at a job level or individual staff level, a better solution for service-based timesheet orientated business is yet to be found. How much did it cost against how much you charged? It can’t get any more real than that.
Profitability plays an important role in every firm’s performance, and so by tracking this KPI you can identify the type of engagements you want to be more involved in going forward, the staff that perform at a higher level and those clients that perhaps it is time to walk away from.
The write off report should not only be used at an operational level, but also a strategic level with the board. Reviewing this report over an entire year with the ability to drill down and slice on different areas creates interesting and robust conversations in a board meeting.
Summary
With the transition to software like Microsoft Power BI, the 5 KPIs discussed in this article come as a result of the software’s flexibility. It eliminates data integrity and data dumping admin tasks, and you can move forward with better reporting.
Etani has an entire technology infrastructure to allow you to dive into Microsoft Power BI. We have a list of data integrations (including Xero Practice Manager), an online training platform, prebuilt Power BI templates, and your own custom mobile application, all available for download on the App Store and Google Play.
Cameron Lynch
Founder of Etani Business Platform
“If you wanted to know where to start with Microsoft Power BI in your accounting firm, this recent article will take you through where it fits and how you can begin your journey”